• Pipeline Operators
• Pipeline Operators
“Write down the problem and draw a diagram.” This is the phrase I heard over and over again from my father when he helped me with my math and science homework in middle and high school. Break the problem into small, understandable pieces, then the solution often finds itself. He earned a mathematics degree in college and has a very analytical and process-oriented mind.
The field of geospatial analytics is still relatively new for most people and companies. When I arrange an introductory meeting and show real Satelytics project examples (no PowerPoint slides!), people often say something like, “I had no idea you could do that,” or, “That is incredible!”
If your company is exploring what geospatial analytics can provide, here are some questions to consider before you start:
What information are you seeking?
Pipeline integrity, leak detection, and environmental groups are interested in activities within their managed areas. Interests could be the identification of liquid hydrocarbon leaks, methane emissions, encroachments in the right-of-way, land movements, and vegetation management.

Liquid hydrocarbon leak detection.
How big is the feature of interest?
For the challenges mentioned above, the timeliness of notification is paramount. For our midstream customers, this means finding the oil leak or land movement when it is small before it turns into a disaster. For methane detection, the key is finding the specific equipment that is leaking.
Only the highest resolution satellite imagery with a pixel size of 30-50 centimeters can provide those results. Speaking in common terms, this indicates that something the size of a dinner plate could be identified.
Satelytics tasks high-resolution satellite imagery providing specificity. When interviewing other providers, be sure to ask what resolution they are using and what they do with that imagery. Do they truly run analytics, or just deliver mountains of raw data to you?
Beware! Many pretenders want you to believe they can do more than they have actually proven.

Erosion along the pipeline ROW.
Where are you looking?
High-resolution satellite imagery is sold in 100 square kilometer blocks called tiles. Specifying a precise area of interest allows us to minimize the data costs you incur. Don’t buy data you don’t need!
How often do you want to inspect the area of interest?
The sooner the threat is identified, the lesser the risk and cleanup become. Today, satellite revisit frequencies are daily. The amount of information generated and the cost of the data are considerations to be balanced.
We often find our customers are choosing to look for liquid leaks on a weekly frequency with other analyses like geohazards being completed on a quarterly basis. Scheduled monitoring is often supplemented with tasked monitoring in situations of disaster response like heavy rain or windstorms.
Monitor infrastructure areas and get out ahead of risk and consequence.
Can it be quantified?
This is the big question and usually means physical measurements of concentration or rate of the factor of interest. Physical measurements could include the size of a leak down to the square foot, the areal extent of a methane plume, or the area of erosion along a gathering pipeline. For methane, we measure concentration and flow rate. In ROW management, we can quantify native species like grasslands and trees and perform analytical land classifications.
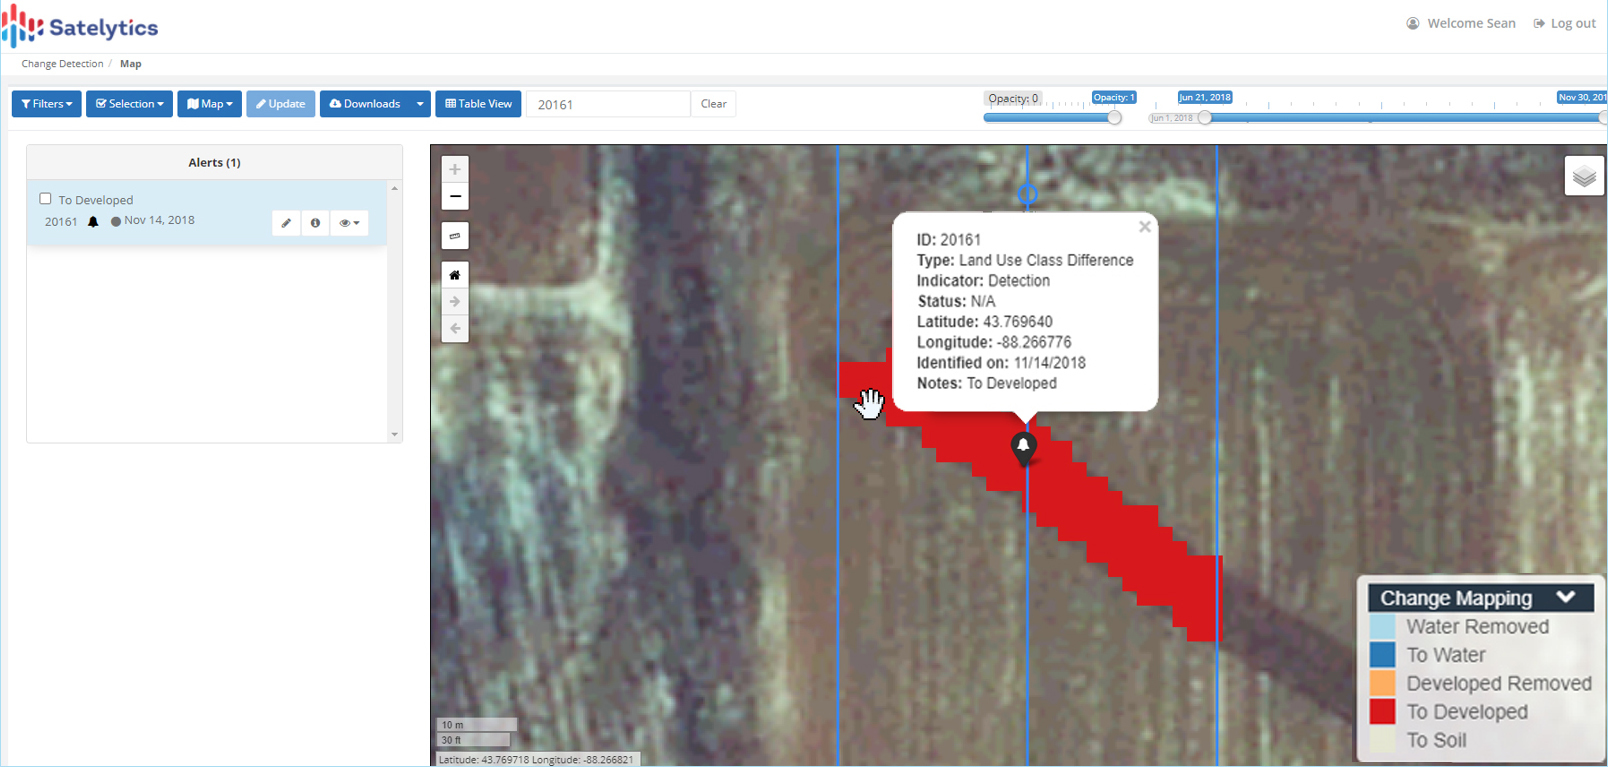
Land use classification.
How long does it take to get the results?
Geospatial analytics can provide useful alerts on the condition of large asset areas, if that information is delivered in a timely manner. Our Constant Vigilance™ algorithms process large data sets with results ready for viewing or downloadable in a matter of hours after imagery is gathered. Current Satelytics customers have chosen our tools after becoming frustrated with long lead times (sometimes months) that have accompanied previous analytics companies and LiDAR-based tools.
The field of geospatial analytics is in its infancy. Satelytics is the market leader, with nearly 700 trillion pixels analyzed to date. We can help you if you define the problem you are trying to solve before you start looking for solutions.
We use cookies to analyze our web traffic and to enhance your experience. By continuing to view this website, you agree to our use of cookies.
Our Privacy Policy