• Oil & Gas,Electric & Gas Utilities,Pipeline Operators

• Oil & Gas,Electric & Gas Utilities,Pipeline Operators
Make no mistake. There is a war on the energy industry, and the hottest skirmish currently is centered on methane emissions. In choosing the status quo, the energy industry hasn’t planned well to win this battle. To win the fight, choose the right technology and the right provider.
“Aerial Surveys Detect Dozens of Methane ‘Super-emitters’ in Permian,” Reuters, January 24, 2022
“Methane Cloud Spotted Near Oklahoma Natural Gas Pipelines,” Bloomberg Green, January 19, 2022
“The Search for the World’s Largest Methane Sources,” BBC, August 5, 2021
When we examine the details of these stories, we learn a couple of things.
These details make for catchy headlines but do not help to reduce future releases. They aren’t actionable. This is merely agenda-driven finger-pointing.
Garbage In, Garbage Out
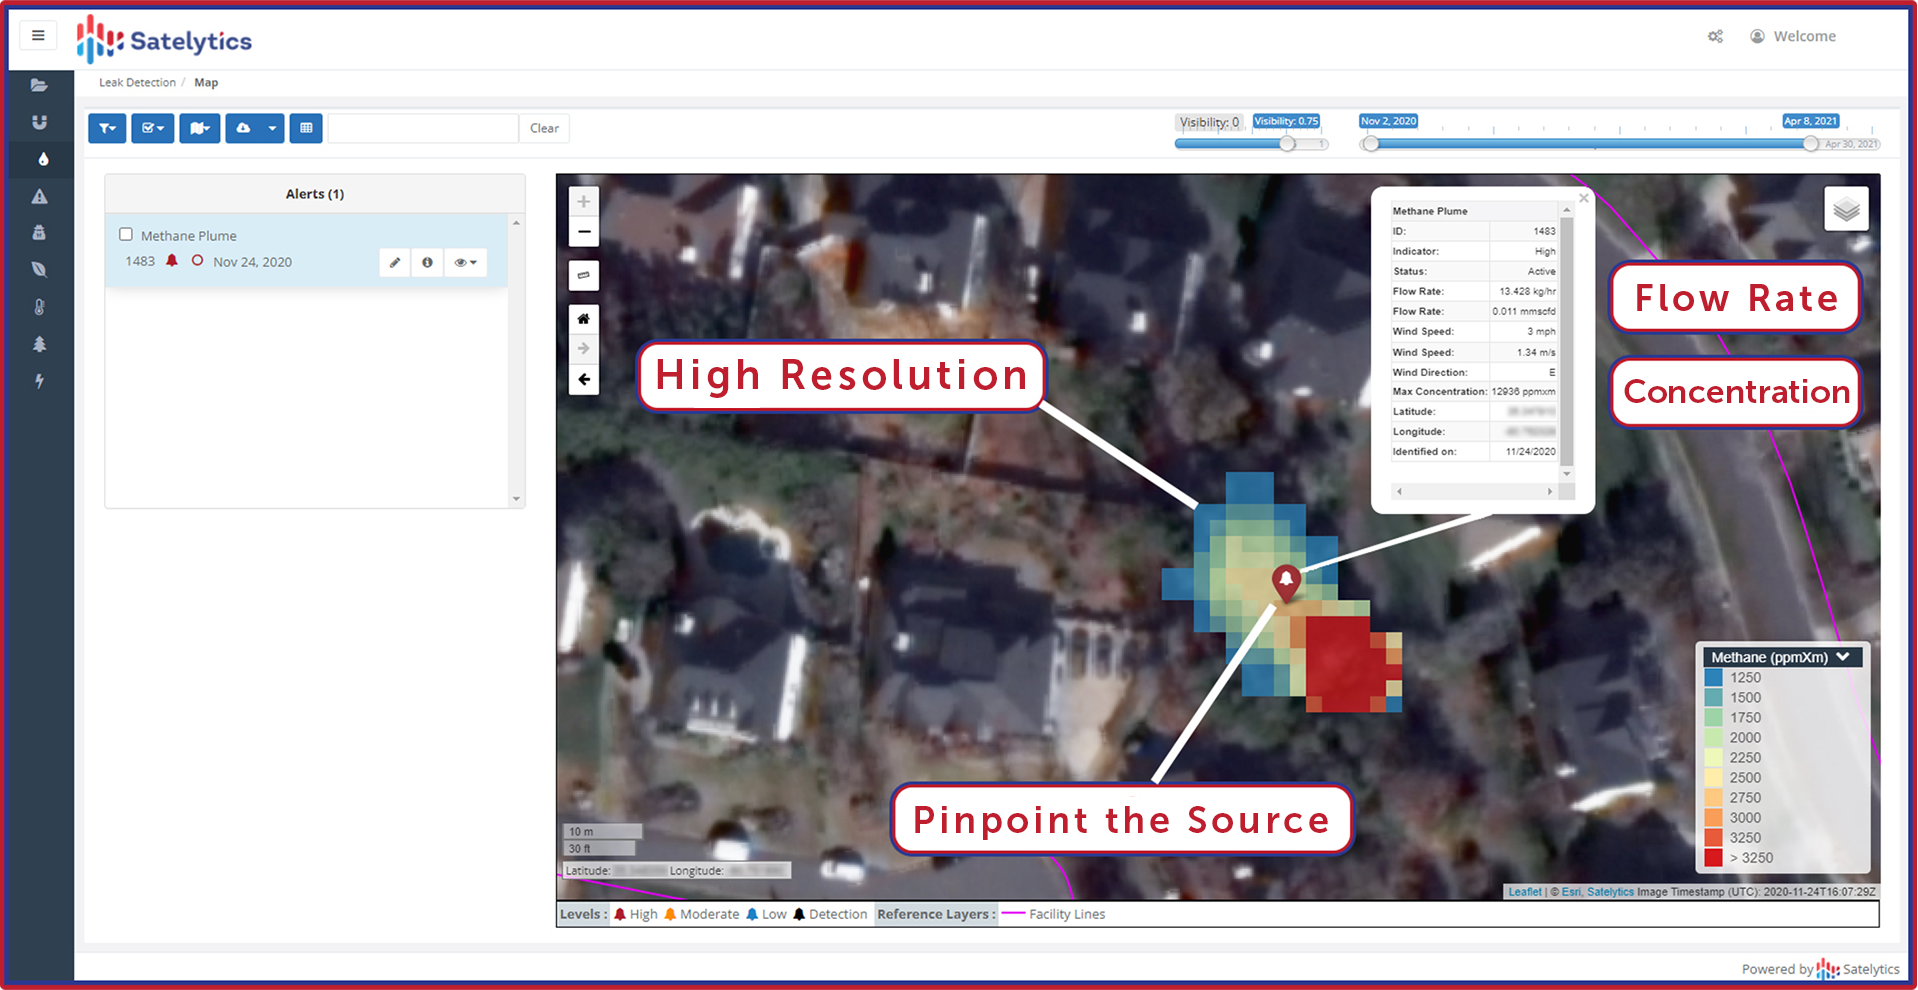
The outputs from a geospatial analytics platform (including flow rate, concentration, and source location) are only as good as the data fed to it.
In many instances, spatial resolution from commonly-cited satellite sensors is too coarse to identify methane sources. Spatial resolution of hundreds of meters cannot identify a plume smaller than that or specify the highest concentration within the plume. So, while the methane graphics in the articles cited above indicate significant methane releases, they do nothing to guide responses to the incidents.
In other instances, where high spatial resolution data from aircraft overflights is used, the timeliness of the data comes into question. How long does it take an aircraft or fleet of aircraft to overfly the entire Permian Basin? And what data infrastructure exists to upload the massive amount of data generated to a location where analytics can immediately be run on that data? A satellite can cover most of any large American oil and gas basin in a matter of minutes, several times a week, and the data is available within hours.
The Satelytics Difference
Satelytics’ methane algorithm has been tested and deployed worldwide by some of the biggest names in the oil and gas and utility sectors and provides detection down to 250 ppm•x•m and 9 kg/hr flow rate within 4 meters of a leak source. We offer a real solution, not finger-pointing.
Consider this critical question: Should an energy company have to worry that their vendors are working for them and the regulator simultaneously? Satelytics doesn’t think so. We have pledged to work for our industry customers only. You won’t find Satelytics’ name in the headlines calling out “maybe” offenders or providing data to regulatory bodies without the permission of our industry customers.

The Satelytics' Difference: Specificity, Flow Rate, Resolution.
With Satelytics, the technology exists today to detect and quantify methane leaks and get out ahead of the finger-pointers. Choose to work with a company that helps you address multiple problems with a single set of data, and choose a company working only one side of the battle.