
Detecting Oil Pipeline Leaks Using Satellite Data: A Case Study in Eagle Ford, Texas
Satelytics can detect small leaks long before the naked eye can see them and head off multi-million dollar consequences.
One of the techniques put to work by the science and software team at Satelytics is to examine vegetation health. This process, one of many used to detect leaks, can provide great insight as a surrogate for infrastructure conditions below the surface.
The big leaks, anyone can spot. SCADA alarms indicate pressure drops with a high degree of efficiency and immediacy. No, it’s the small leaks that go undetected for months that are of concern to our operations.
Here is how it works: The spectral indices of vegetation growing near oil and gas pipelines is an excellent indicator of hydrocarbon leakage. Remotely sensed hyperspectral data has long been used to monitor phenology, and to measure the relative density and health of vegetation. Established indices, in particular the Normalized Difference Vegetation Index (NDVI) allow scientists to classify typical growing conditions. Once those normal growth parameters are established, any changes due to hydrocarbon pollution (leaks, spills) can be identified. In short, the concept is similar to early mining days where a canary was the most important companion for the miners.
Oil spills directly cause biophysical and biochemical alteration of vegetation, which is then detected in the spectral signature. Hydrocarbon leaks alter the soil and interfere with nutrient and oxygen uptake, thus weakening the photosynthetic cycle. Chlorophyll concentration and water absorption are affected, and in turn the plant foliage characteristics change. Since vegetation health indices register the norm, even minute changes can be detected by Satelytics software.
Satelytics in Action
The Eagle Ford Shale Play in Texas, the most capital intense oil and gas development in the world, has had a huge impact on the oil and gas industry. Nearly $30 billion went into the development of the Eagle Ford Play since it began in 2013. At current, 44 rigs are running over the Eagle Ford, Texas area and are potentially expected to recover 10 billion barrels of oil. This is a hydrocarbon rich area that lies directly beneath the Austin Chalk. The Upper Cretaceous Austin Chalk is an historically well-known onshore oil and gas play that extends across south-central Texas into southern Louisiana.
This very large oil producing region relies heavily on pipelines to transport the shale oil to refineries. The area has shallow soil with concentrated sodium and chloride ions (salts,) and the shale oils themselves contain hydrogen sulfide (H2S,) all of which set the stage for aggressive corrosion.
The operator in our case study discovered the leaks while surveying the line (on another issue) in late 2015 where visible hydrocarbons were bubbling on the surface. Satelytics was asked to look back in time to establish (if possible) when this leak started and when would Satelytics have raised the alert. The ability to extract retroactively the same level of analysis as if the data were gathered today is a technique long applied and adopted in other business areas that Satelytics addresses such as regulatory reporting, litigation support, environment health and safety (EHS and HSE). In the example illustrated there were two sets of available data: February and August 2015.
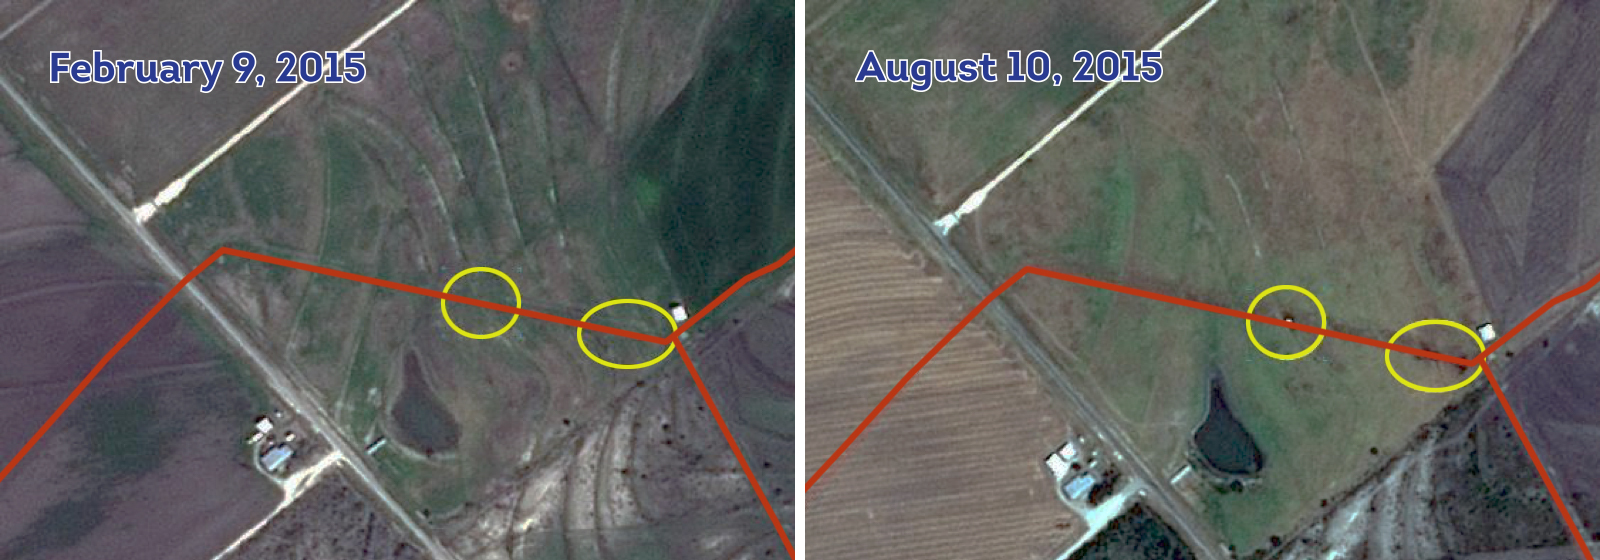
Satelytics applied its techniques to both sets of data and established that there were no leaks in February, but the leaks are clearly visible from satellite imagery captured in August.
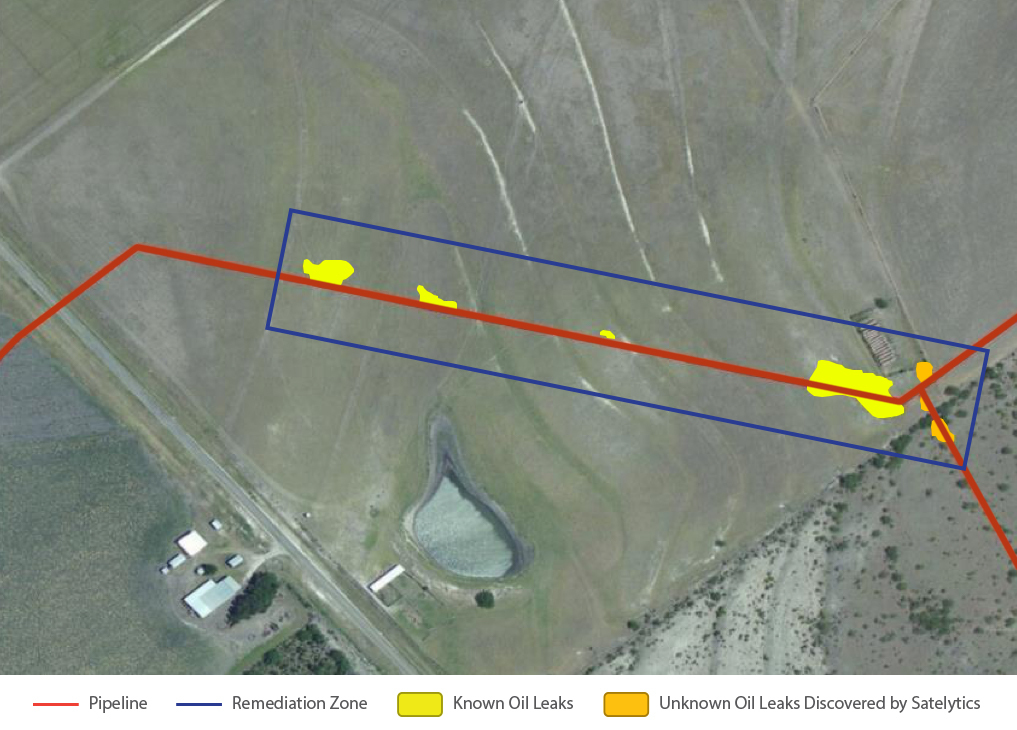
In October 2015, the operator was aware of only four leaks. Red represents the eight-inch buried transmission line. The leaks the operator was aware of are highlighted in yellow. The blue rectangle represents the multi-million dollar remediation. Two leaks, highlighted in orange, that had gone undetected by visual inspection by the operator, were discovered by Satelytics.
Two leaks that had gone undetected by visual inspection were discovered by Satelytics.
Satelytics estimates that it would have assessed, identified, and alerted the operator shortly after the image capture in February. The next series of image captures would have shown the infrared signature of vegetation health to have altered. This would not have been visible to the naked eye. The cost of monitoring a very large area—which would have included the case study area—would have yielded payback within 2.11 months for the pipeline operator. The length of the time of the undetected leak could have been barely a few days or weeks rather than eight months that the leak persisted. The financial impact from remediation would have been reduced by over 93%.
The financial impact from remediation would have been reduced by over 93%.
Satelytics pipeline offers a whole suite of oil and gas monitoring services delivered via cloud software on the Amazon Web Services platform (SaaS). The software suite constantly monitors for a number of impactful operational events. The solution offers critical infrastructure protection, and allows operators to minimize consequences and significantly mitigate risk. Satelytics is not the only source of data you will use, but it is a critical component, illustrating with a high degree of probability and specificity where you need to look and focus your resources.
