White Paper • Pipeline
Pipeline Right of Way Assessment Using Satellite Imagery and Automated Change Detection
Introduction
Using imagery analysis techniques, proprietary algorithms with issued U.S. patents and trained scientists, we are able to provide valuable data products to the pipeline industry. At Satelytics, our priority is cutting edge technological developments so we can provide our clients accurate, cost-effective imagery products as quickly as possible.
Current advances in satellite and computer technology are making it possible to completely change the way companies conduct their pipeline right of way assessment. Utilizing new image acquisition platforms known as “nano-satellites” or “cube satellites” empower us to acquire high-resolution, low-cost imagery with frequent revisits. We can detect and classify objects on the ground more accurately and quickly than with human-based observation. Today, Satelytics is serving pipeline operators with solutions that enhance safety and uptime, and leads in the implementation of transformative Pipeline Right of Way Assessment technology.
Current Practices
According to the US Department of Transportation1, there were 1,718,407 miles of oil and gas pipelines in 2012. New pipelines are currently under construction, and every single mile of pipeline requires routine inspections.
The industry standard is to visually detect encroachments, change, and to classify land use in the Right-Of-Way (ROW). Certain problems associated with current monitoring practices include:
- Cost – Annual and biweekly aircraft patrols flying over the ROW to monitor for encroachments is expensive.
- Accuracy – Human analysis during flyover is subject to error.
- Time – Change detection and encroachment monitoring are time-intensive processes. Results may not reach the proper channels quickly, and due to infrequent visual inspections problem areas in the ROW may develop during the gaps between inspections.
- Archival Data – Little archival data is obtained from today’s aerial inspections.
Change Detection
We automate the change detection process, clearing valuable man-hours for use on other tasks. We are able to identify new and demolished urban features, stream channel change, bank erosion, structural changes in water bodies, and other land use changes that potentially impact pipeline integrity. Our change detection process reduces the amount of operator error, and can be performed as often as the imagery is acquired. Spectral analysis under development may be able to detect changes in vegetation that are associated with low level pipeline leakage.
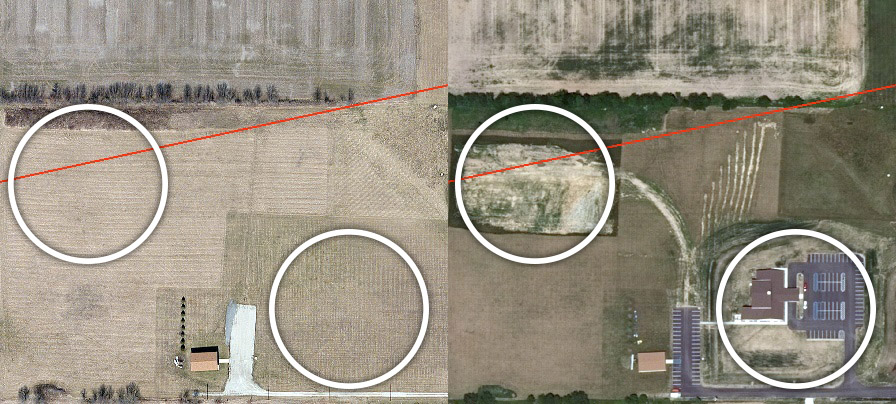
Figure 1. The two images represent a rural area that has experienced man-made changes between 2012 and 2014. Our algorithms automate the change detection. Red indicates pipeline routing.
Encroachments
Encroachment analysis detects the presence of man-made objects which potentially threaten pipeline integrity, such as a bulldozer or backhoe parked within the ROW. Operators can access this information quickly, providing an opportunity for damage prevention.
This analysis also detects and monitors for changes related to structures such as houses, businesses, garages, sheds, fences, pools, ponds, or other man-made objects within the pipeline company’s ROW. By using a team of dedicated analysts and acquired imagery, we negate the operator error of an aerial flyover with GPS point collection, and create an archival imagery database. The emergence of nano-satellite technology has the potential for more frequent monitoring of pipeline ROW.
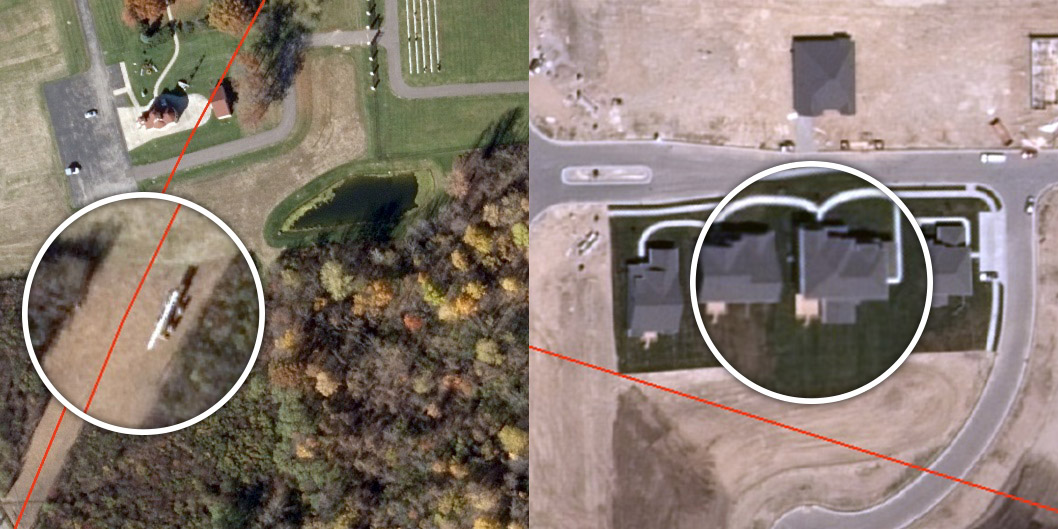
Figure 2. These 2014 images show (on left) a farm vehicle in the encroachment area and (on right) man-made structures beginning to encroach on a pipeline routing. By building an imagery database, encroachments can also be archived and analyzed for patterns representing urban sprawl and population growth. Red indicates pipeline routing.
Population Growth
Monitoring the number of new structures per mile along defined ROW enables the development of population “heat maps” showing where significant increases in population are occurring. Companies can then focus resources on high impact areas.
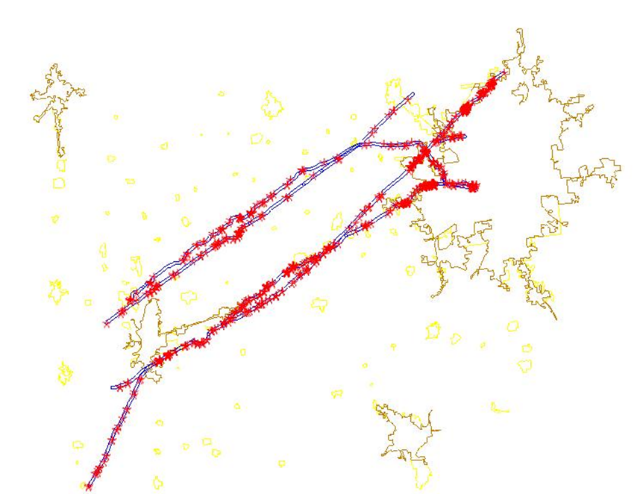
Figure 3. Population growth 2012 to 2014. Red stars denote significant increase in population over a two-year period.
Land Use Classification
Land classification is an essential tool for ROW monitoring, and can be used in conjunction with change detection and encroachment analysis. Determining what types of land use and changes in usage will highlight areas that potentially impact pipeline operations. We can help you build and update your land use database so you can locate changes, discover trends, and track urban growth.
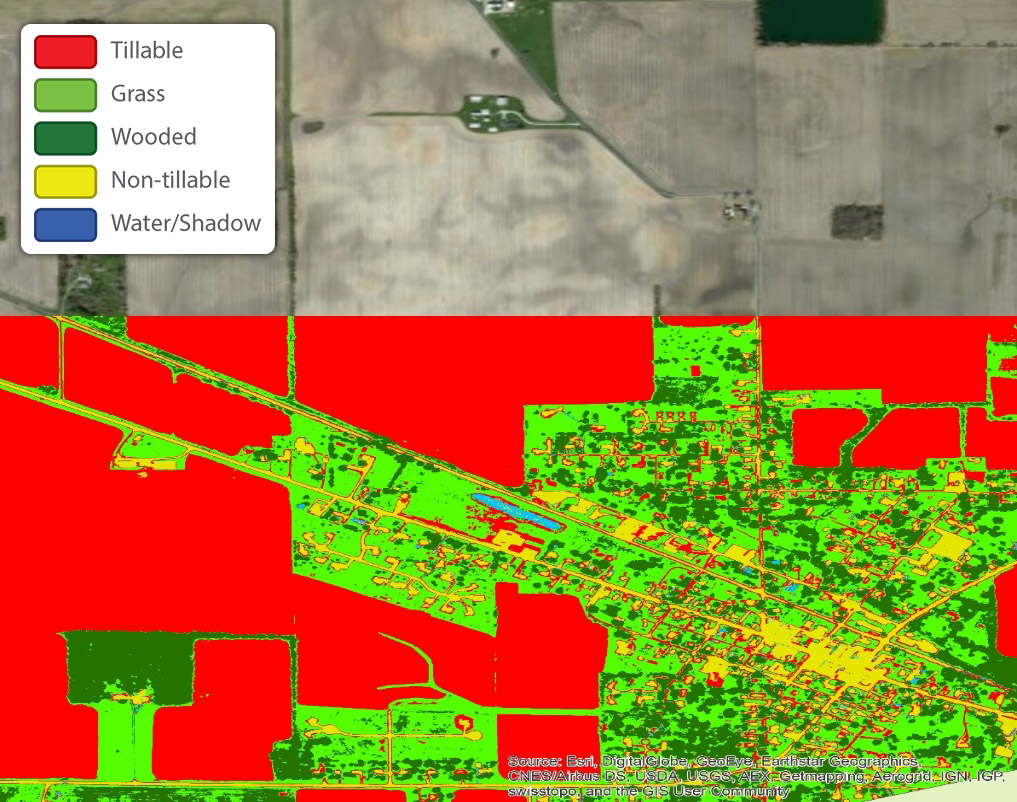
Figure 4. Classifiers are chosen and trained on specific areas of the image. Algorithms quickly classify the whole image, producing accurate high-resolution land use maps. The classified image is displayed here with an ESRI basemap2.
Multiple Operator Data
Since many pipeline operators’ ROWs run contiguously, one set of imagery can be used for multiple operators, this will reduce the cost and help in maintaining essential confidentiality. Allowing multiple operators access to ROW data will open new facets for analysis of datasets.
Conclusion
Utilizing intelligent remote sensing technologies is a paradigm shift that is occurring in industries around the globe. Traditional methods of manually collecting information then using humans for analysis are costly and prone to operator error. With proven methods for automated change detection, encroachment analysis, land use classification, population change detection, stream and river bank erosion and water flow change detection, Satelytics can help cut costs while providing the reliable, precise data you need to maintain your ROW integrity. We will provide your team with the most current information available on the status of your pipeline—at your desktop, on your tablet, or on your smart phone.
For more information please visit www.satelytics.com or email info@satelytics.com.
1: http://www.rita.dot.gov/bts/sites/rita.dot.gov.bts/files/publications/national_transportation_statistics/html/table_01_10.html, accessed February 13,2015
2: Basemap source: Esri, DigitalGlobe, GeoEye, Earthstar Geographics, CNES/Airbus DS, USDA, USGS, AEX, Getmapping, Aerogrid, IGN, IGP, swisstopo, and the GIS User Community
