White Paper • Power Utilities, Water & Wastewater
Using Algorithmically Enhanced Satellite Data to Measure Water Temperature
Introduction
Temperature is one of the most important parameters for assessing the state of a large body of water. Even small thermal changes can have catastrophic consequences on marine life. Increasing water temperatures cause a negative chain reaction of effects including decreased oxygen and other gases, and elevation of dissolved minerals which degrades water quality. These adverse thermal changes inhibit a water body’s ability to support healthy flora and fauna in aquatic ecosystems. Increased temperature has also been linked to profound occurrences of harmful algae growth.
Satelytics has developed a patent-applied method to derive water surface temperature from satellite images—enabling rapid and cost effective thermal assessment across entire bodies of water and over large regional areas. Landsat satellite imagery effective samples approximately 5 samples per acre, thus allowing for a statistically significant evaluation of trends in surface water temperature and a more accurate determination of historical temperature changes than can be provided with stationary and single point monitoring techniques. This paper describes and exemplifies the process using data collected by Satelytics in the evaluation of our algorithms.
Failure to evaluate the full extent of water body temperature changes could lead to a fatal misunderstanding of the fundamental causes and compromise remediation efforts.
Acquiring measurements by conventional means can be difficult and expensive as temperature can vary dramatically owing to such factors as water body depth, sunlight energy, local weather conditions and industrialization. Failure to evaluate the full extent of water body temperature changes could lead to a fatal misunderstanding of the fundamental causes and compromise remediation efforts - thus the importance of characterizing a water body in its entirety. Traditionally, analyzing water quality has been hindered by a variety of factors including large surface areas, time, manpower, budget constraints, and limited access to data collection points. Assumptions based on too few data points may mischaracterize conditions in unobserved areas of the whole water body, hence the need to conduct a total water body analysis.
Currently, temperature measurements are achieved either by direct in-situ capture or by setting up monitoring stations with appropriate sensors and transmission equipment, both of which require occasional to frequent on-site presence. This is not only inconvenient, expensive and potentially dangerous, but neither method provides adequate data to analyze the whole water body. Man-power intensive monitoring for sparse data indicates that there is a need for an efficient and cost effective method for determining the temperature of large bodies of water.
Our Process
Satelytics has developed proprietary methods to measure the temperature of a water body utilizing information acquired from satellite data. Further, archived information allows Satelytics to provide surface water temperature analysis maps of various water bodies back to 1999.
Algorithm Correlation
The Satelytics temperature algorithm was tested against onsite data collected by the NOAA National Data Buoy Center and achieved a very high level of correlation. In addition, we have confirmed that our methods apply equally to fresh and marine waters and are unaffected by location or water type.
The National Data Buoy Center (NDBC), under the auspices of the National Oceanic and Atmospheric Administration (NOAA), creates and maintains a network of data collecting buoys throughout most coastal waters. These buoys measure and store data such as air and water temperature, and atmospheric pressure. Some buoys have data dating back decades while others have data from just the past few years, providing a large set of data points during the historic timeframe of satellite image acquisitions.
Our project was designed to test the algorithm created by Satelytics against the data collected by the NDBC. Initially a preliminary selection of buoys was developed which included buoys that were at least 60 meters from shore (to ensure that the pixel containing the buoy was entirely over water.) We eliminated all buoys that sampled water temperature from depths less than one meter to assure the comparison of only surface temperatures. We also selected buoys in both fresh and marine waters to illustrate that salinity is not a factor in temperature determination. Further, we chose buoys from different areas of the country, especially from areas that we assumed would have different temperatures in order to broaden the effective range of the algorithm. All locations used are shown in Figure 1.
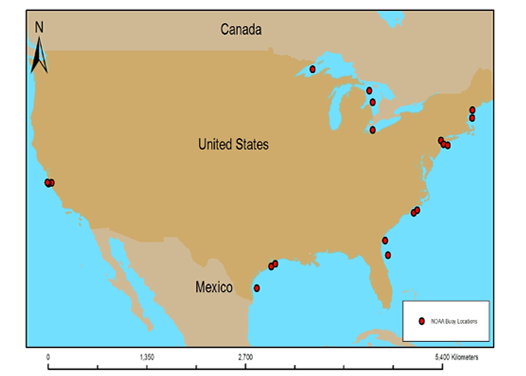
Fig. 1: Locations of all NDBC buoys used for testing the Landsat Temperature Algorithm created by the Satelytics team.
After selecting our locations, we chose dates corresponding to a Landsat ETM+ overpass. NDBC buoys sample at least hourly and some more frequently, allowing buoy reading to be correlated to +/- one hour of satellite overpass1. Data that met our requirements is shown in Table 1. For the final analysis, the 60 points on which we tested our algorithms spanned 16 locations with dates ranging from May 26, 2003 to December 29, 2011. Buoy temperature data ranged from 1.9 degrees Celsius (35.42 degrees Fahrenheit) to 27.6 degrees Celsius (81.68 degrees Fahrenheit).
1. We have determined that synchronous or quasi-synchronous satellite to ground-truthing data ensures the greatest accuracy when developing algorithms.
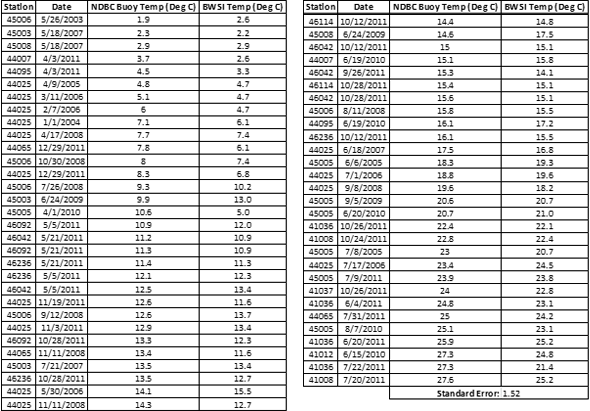
Fig 2: Graph of the NDBC Buoy Data vs. the Satelytics Temperature Algorithm, with R2 shown.
Results and Discussion
The results showed a very high correlation (R2 ~ 0.95). Figure 2 is a plot of the NDBC buoy data (Table 1) against the temperatures determined from the Satelytics algorithm. This correlation shows how well that the algorithm maps correct temperatures in all ranges. The standard error is shown at the bottom of the table (1.52 degrees C).
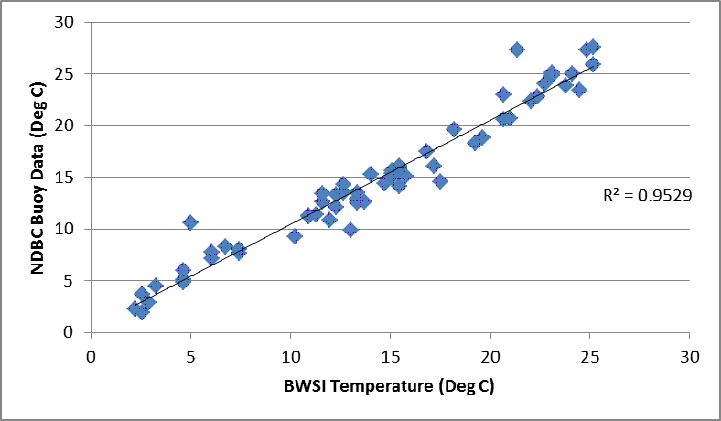
Fig 2: Graph of the NDBC Buoy Data vs. the Satelytics Temperature Algorithm, with R2 shown.
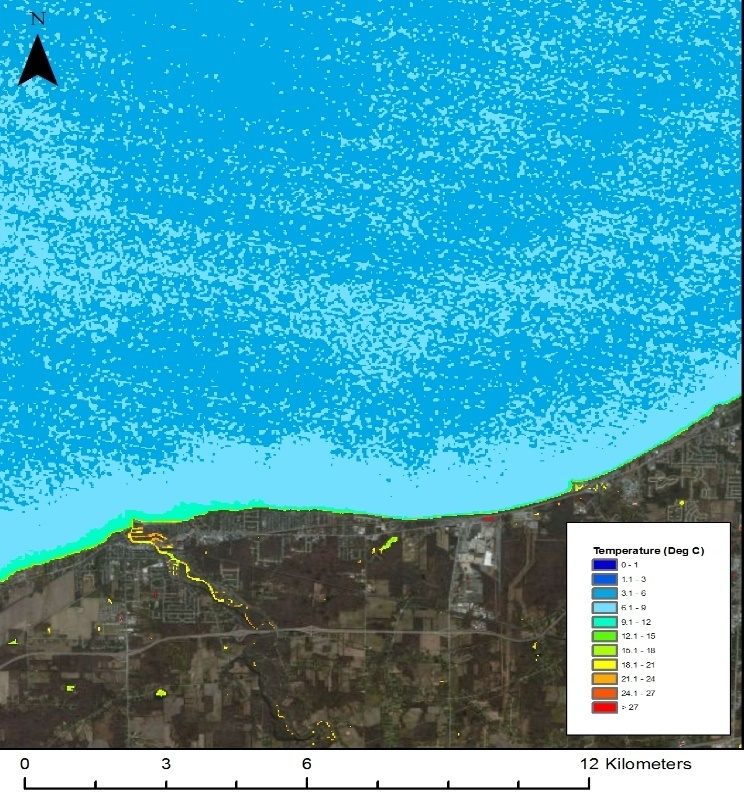
Fig. 3: Processed image showing temperature of Lake Erie West of Lorain, OH on April 1, 2010.
Sample images produced by the Satelytics temperature algorithm are given in Figure 3 which shows Lake Erie just West of Lorain Ohio on April 1, 2010, and Figure 4 showing the Atlantic Ocean just off the coast of Edisto Island on August 5, 2011. These selections show the range of the temperature algorithm, with Figure 3 having lower values and Figure 4 showing higher values.
While the data confirms that the temperature algorithm and buoy data have a very high correlation, occasionally the coastline appears much warmer than the rest of the water body. This is an artifact of Landsat ETM+ resampling. The USGS resamples the 60X60 meter thermal pixels to 30X30 meter pixels, which is the same resolution as the other Landsat multispectral bands. This means that, along the coastline areas, pixels may contain data averaged across both land and water. If the land is much warmer than the water, part of the coastline might appear warmer in the image than an in-situ sample. This problem should be almost completely eliminated approximately 60 to 90 meters away from the shoreline.
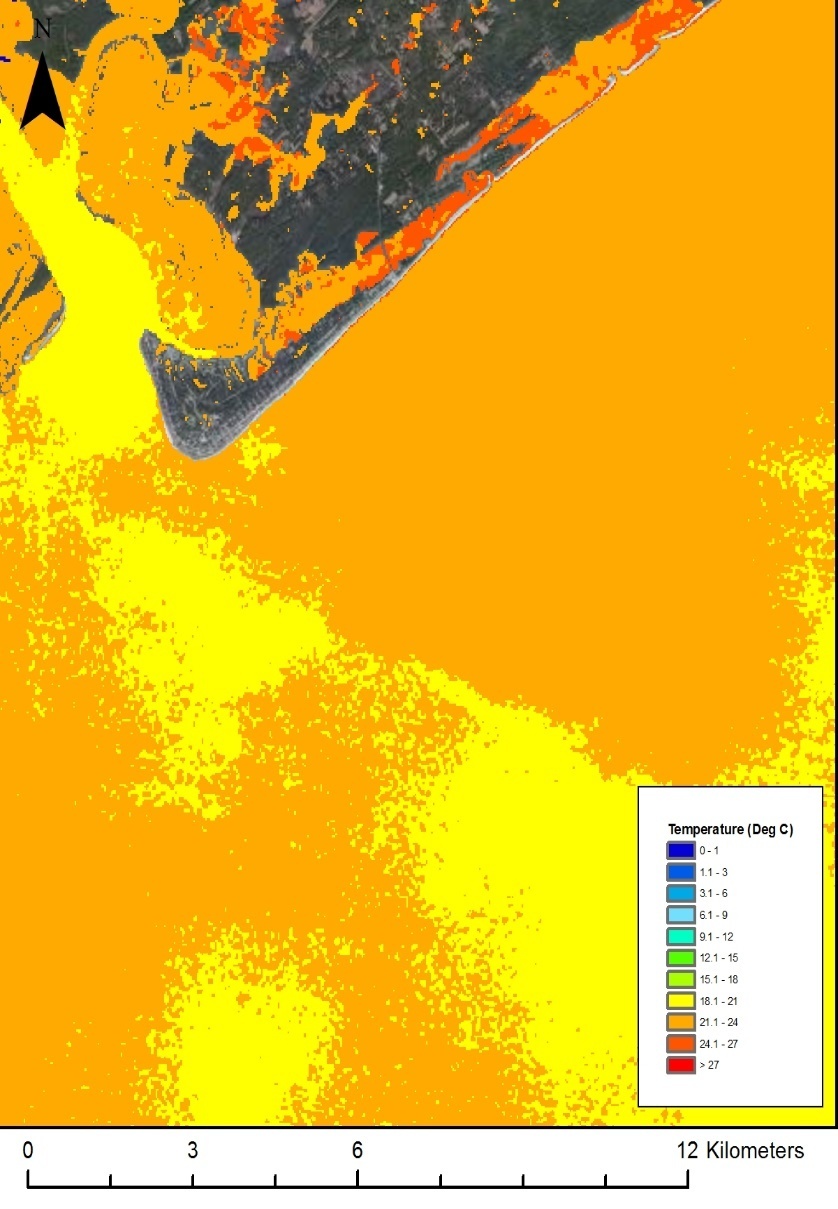
Fig. 4: A processed image showing temperature of the Atlantic Ocean near Edisto Island on August 5, 2011
While the issue of mixed land and water pixels may cause some inconsistencies directly along the coastline, it does not obscure the thermal plumes from other sources. In the case of the of Lake Erie image (Figure 3), there is a small river discharging much warmer water into the Lake (noted by the red arrow). This is evident from the large, warmer plume of water directly at the outfall of the stream. This plume extends further than 100 meters from the shoreline.
Figure 4 shows an inverse condition than observed in Figure 3. Colder water coming downstream discharges into the Atlantic Ocean. More research on this, area including temperature collection during tidal changes, as well as imaging further up the river could establish where this colder water originates. It does not appear at this scale that any resampling errors are an issue.
Case Study I
One Satelytics client was asked by an environmental regulatory body in Canada to reduce temperature effluent from its manufacturing facility. The regulatory body was concerned that the temperature effluent from the client’s facility could harm the fish population. Using the capability to look back in time, Satelytics provided the client with data that showed that its effluent temperatures hadn’t changed over the last 20 years. This data led the regulatory body to conclude stricter thermal regulations were unnecessary.
Clients complying with EPA 316 temperature regulations use Satelytics data as a more robust way to measure temperature profiles. Today ground based point sampling is used with models to predict thermal distributions for 316 compliance. Satelytics measures actual surface temperature at 5 measurements per acre which gives a much more accurate and complete thermal profile. US EPA Region 5 has given preliminary approval to use Satelytics data for a thermal monitoring project in Indiana.
Case Study II
Another Satelytics client applied the use of Satelytics' patented surface water temperature algorithm to assess the extent and distribution of a thermal discharge adjacent to sensitive receptors. Satelytics imagery was used to calibrate water models to predict the plume extent. Post calibration of the models coupled with Satelytics imagery allowed for a true-to-life snapshot of the plume distribution within the water body. Satelytics imagery allowed the client to display the surface water impact of the thermal discharge and display that the impact did not directly interfere with any sensitive receptors. The client was also able to refine and vastly improve at-depth temperature modeling using the vast amount of imagery provided by the Satelytics surface water temperature algorithm.
Proper deployment of the Satelytics surface water temperature imagery can reduce cost and increase understanding of water bodies. Using Satelytics' ability to look back in time allows clients to assess the impact of past events within their entire water body. As satellite technology continues to evolve and imagery sources become more readily available using imagery to solve complex problems will be the best path to understanding the world.
Summary
Satelytics offers an accurate, affordable, and practical alternative to conventional temperature measuring of entire water bodies. Using historical Landsat ETM+ images and data from the NDBC buoy system, Satelytics correlated their surface water temperature determination algorithm to field samples from the buoys with an R2 ~ 0.95. These results show that the algorithm works equally well in different areas of the country and in both fresh and marine water environments. This product is a uniquely effective method for producing accurate temperature maps of water bodies.
This cutting edge process represents an exemplary method for gathering wide-ranging data that is unavailable using traditional techniques.
This cutting edge process represents an exemplary method for gathering wide-ranging data that is unavailable using traditional techniques. The 5 effective samples per acre allow for a statistically significant evaluation of trends in temperature and a more accurate and more detailed determination of historical temperature changes throughout the entire water body. Our clients have access to a number of important benefits with this product:
- Satelytics algorithmically enhanced satellite images provide data for the entire water surface. This allows the user to develop comprehensive temperature maps as well as historical comparisons that cannot be achieved by other methods. Clients are able to focus on the most significant sources of surface water temperature changes.
- Satelytics can provide historical data back to 1999 at 60 meter resolution (resampled at 30 meter by USGS). Historical data is often unavailable by any older conventional data collection methods. Clients who require evaluations in areas where their own historical data are unavailable and when determining Total Method Detection Limits (TMDL) will
- find advantage in the data analysis provided by Satelytics' temperature algorithm.
- Our data can be used to validate other models (such as TMDL.)
- Satelytics can analyse water bodies that are generally inaccessible due to the terrain.
Specifications
Based upon this field correlation exercises conducted by Satelytics:
- Temperature Image Resolution: 60m x 60m per pixel (resampled to 30m x 30m)
- Temperature measurement range: 1.9 degrees C to 27.6 degrees C
- Temperature measurement accuracy: 1.52 degrees C
Results for each analysis will be presented to the client in either a standard or expanded
report format:
- Standard reports include a brief description of methodologies and results (.pdf), a figure file (.jpg) and/or an image GeoTIFF file enabling surface water temperature data to be imported into multiple mapping platforms.
- Expanded reports contain files for all images, figures, relevant graphs and statistics for each processed image date as well as a detailed discussion and analysis of thermal measurements and observed temperature changes provided by our Professional Services team. As well as future project suggestions to better understand and assist clients with using complex remotely sensed data.
For more information please visit www.satelytics.com or email info@satelytics.com.
